Viewing electron density data
This application can open and view electron density data, including superimposed on computed atom positions. Several file formats are supported. This is similar to that provided in the Coot software.
Input formats
We accept the following input formats: Map, MTZ, and 2fo-fc.mmcif (a mmCif variant). Map and MQT are binary formats which contain density data directly, as amplitudes over 3D space. Map is in a format that can be directly loaded into our display engine, with minimal processing.
2fo-fc files are different: they contain comparatively unprocessed
experimental data (e.g. reflections data), which must be converted to amplitudes over space using a 3D Fourier transform.
We currently rely on Gemmi to open both MTZ and 2fo-fc files. This is bundled
with the Windows version of this application, and is optionally installed on Linux via its setup script.
On Windows, gemmi must be kept next to the Molchanica executable, or added to the system Path. On Linux, you
must select "yes" when asked by the setup script, or otherwise have it available on the Path.
When opening 2fo-fc or MTZ files, this application first converts them to a Map file by calling Gemmi, then reads and deletes the generated map file. This is a transparent process, and requires no special action.
In the case of 2fo-fc, Gemmi performs a 3D FFT to convert complex Miller index data to a function of real density values over space. This procedure bears similarities to the long-range Ewald computation we use to model Coulomb forces.
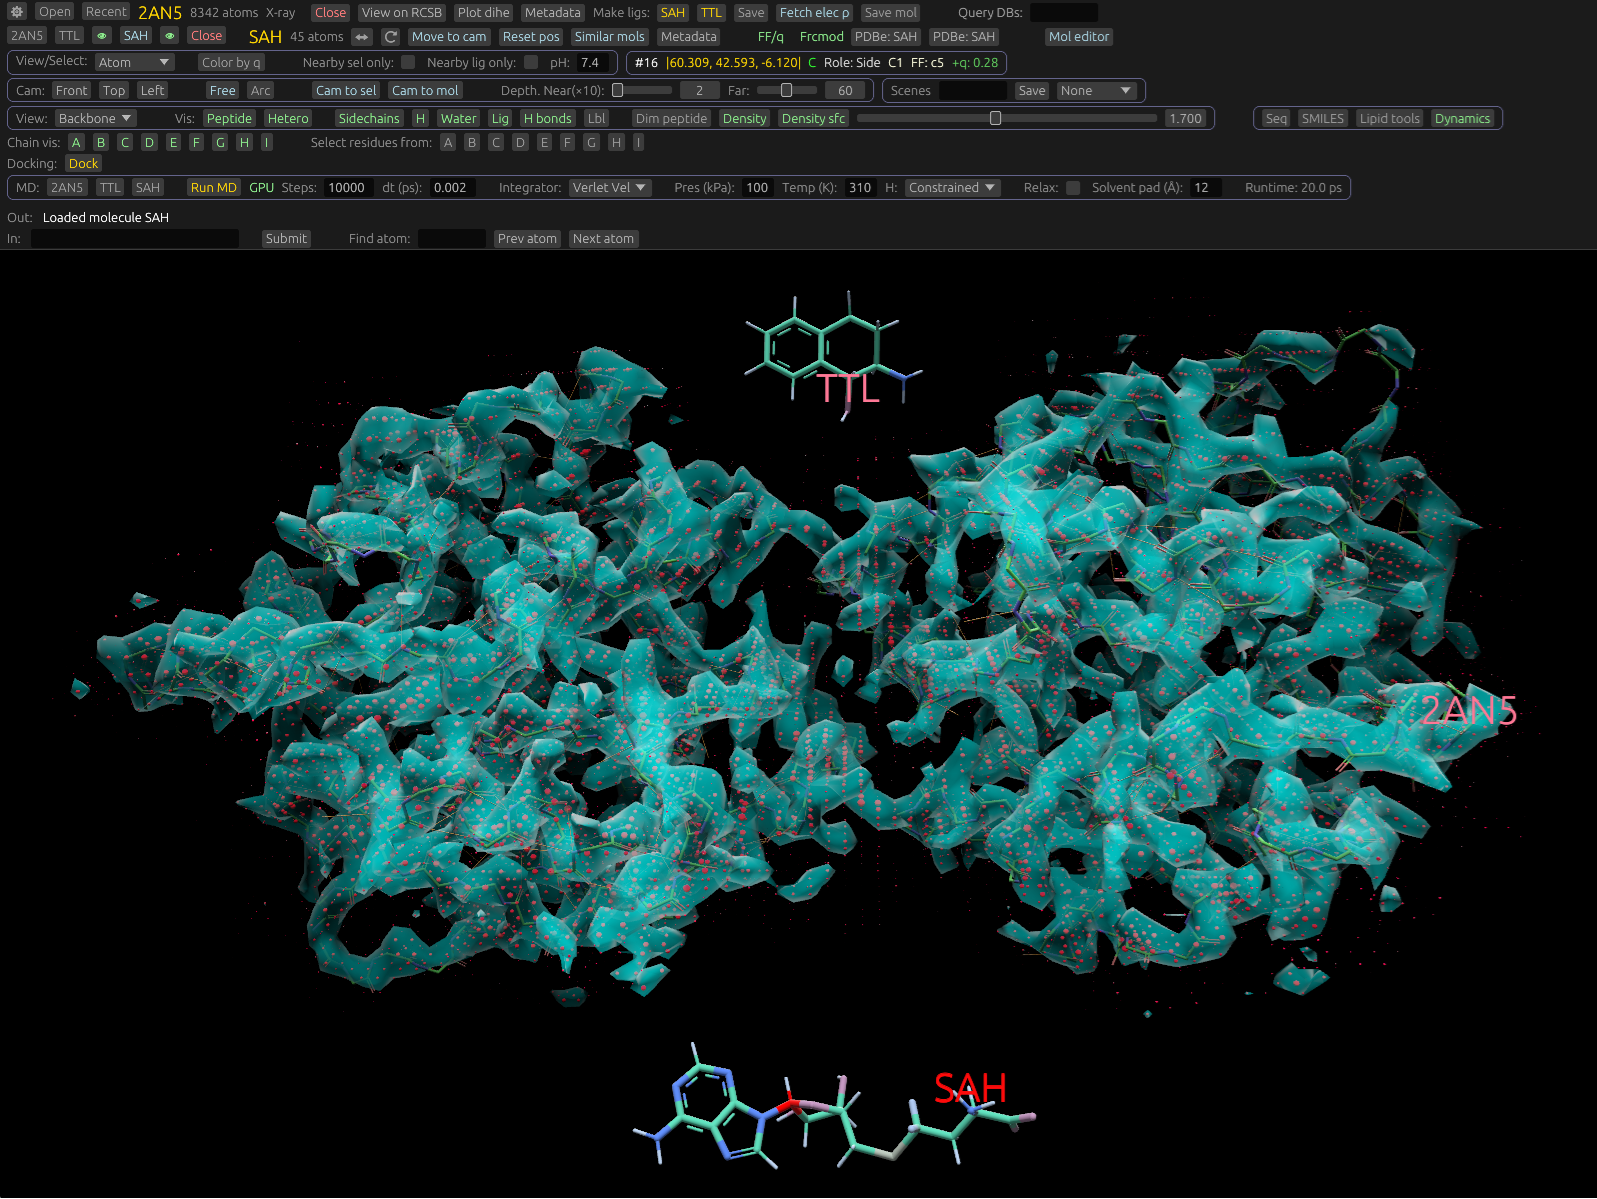
Visualization
There are 2 visualization modes: an iso-surface, and spheres. These can be toggled on or off independently using the Density surface, and Density buttons in the UI.
The Iso surface draws a transparent surface across all points where electron density equals a specific value. You can set this level with a slider in the UI. Setting a higher value draws the surface further out from the atom positions; setting it lower draws it closer in. For given density data, you should experiment with this value.
The other mode displays a bright dot at each lattice point. These dots vary in both size and color saturation based on density data at that point. They are ommitted for very low density values. Their size scaling isn't linear with density, but set in a way that facilitates visualization.
The density display uses atom coordinates to assist in its visualization. The density data itself is periodic due to the nature of how it was derived. To prevent repeats, or data displayed from secondary images, we position and filter it to be nearby loaded atom positions (e.g. from RCSB mmCif data).